A patent landscape provides a bird’s-eye view of the patenting activity related to a specific technology. It can be an invaluable tool for your organization as the analysis of patent data reveals business, scientific and technological trends.
Indeed, many industries increasingly rely on patent landscapes to provides a basis for understanding innovation activity in their field. A landscape can tell you which organizations are working in your field, where they file their patents, who are their key inventors, and much more. The information derived from a patent landscape analysis can help you identify whether competitors are encroaching on your core market, design around others’ technology, identify licensing and M&A targets, headhunt new talent, and reduce legal risks, among others.
A patent landscape analysis is a powerful tool as the insights it uncovers allow for forward-thinking, data-backed decision-making in business strategy, R&D investments, and IP strategy.
To illustrate the usefulness of patent landscapes, we provide you below with some very high-level data on the patenting of cannabis-related technologies. Keep in mind that, when performing a patent landscape analysis with the help of your patent agent, much more information is provided and each set of data can be further drilled down to get ever more detailed information. Below, you will see how we could easily identify and measure the impact of the recent changes in the legal status of cannabis. This is a convincing demonstration of the power of patent landscape analysis to identify trends in a given industry.
Please contact us to explore how a patent landscape analysis can provide your business with similarly powerful data in your field of expertise.
Cannabis Patent Landscape analysis
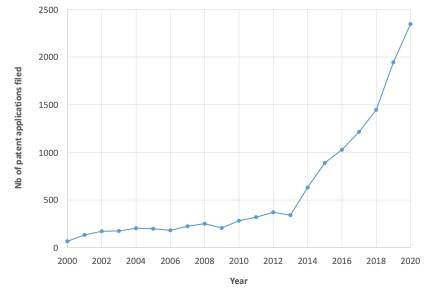
Let’s start with the number of patent applications filed each year. Variations in the number of patent applications filed tell you whether your industry is growing, declining, or mature (stable). Also, the appearance of patent applications tends to correlate with new innovative products entering the market. An increased number of recent applications foreshadows the apparition in your market of more numerous innovative products, thus increased competition. A low or decreasing number of recent applications indicates a less active area to technology where any new innovative product you launch may more easily distinguish itself from those of your (decreasingly innovative) competitors.
For cannabis technologies, figure 1 shows that, after remaining more or less stable from 2000-2013, the number of patent applications filed doubled in 2014 and then continued to increase rapidly in the following years. This trend is expected to continue, albeit slower, with a predicted number of patent filings reaching 3000 in 2025. The 2013 inflection point clearly shows the impact of the changes in the worldwide legal landscape regarding cannabis throughout the years. Indeed, on November 6 and 10, 2012, the recreational use of cannabis was legalized for the first time in the American states of Washington and Colorado. These events signaled the opening of a very large market and triggered a so-called “Green Rush”, which saw the birth of multiple companies and the creation of hundreds of thousands of jobs in this new industry.
Figure 1. Nb of patent applications filed per year
Let’s turn now to the countries from which these patent applications originate. The country of origin of the patent applications in your field indicate where your innovative competitors are located. A large number of patent application originating from a given country may be reflective of the quality of the local environment supporting innovation in the field in term of, for example, increased access to capital, a larger pool of skilled talent, advantageous legislation, etc. Hence, such a country could be a worthwhile option to consider when opening a new branch, seeking a new partnership, or looking to acquire smaller innovative competitors. Also, an increasing number of countries from which technologies originate is indicative of growing global interest in your field. Conversely, a decreasing number of countries indicates that innovation in your field is being consolidated in specific geographical areas and could prompt you to research the reasons behind this shift e.g., market interest, legislative environment, extensive M&A, etc.
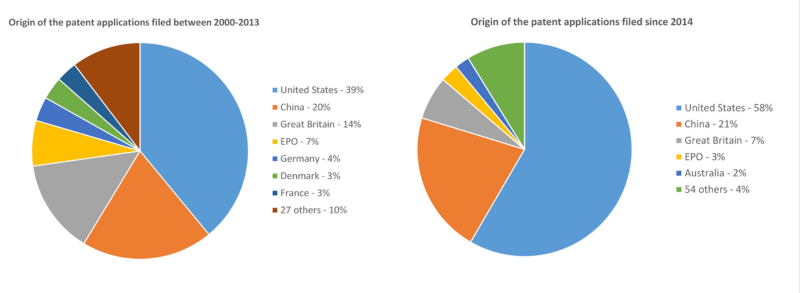
Fig. 2 below shows the countries from which the cannabis-related patent applications originate. The number of countries producing these patent applications nearly doubled, going from 34 for the period between 2000 and 2013 to 59 since, showing increased global interest. Nevertheless, innovation on cannabis is now more concentrated as a larger share of the applications come from the top 4 jurisdictions showing that this global interest did not raise equally everywhere. Indeed, together the United States, China, Great Britain, and Europe account for 89% of the patent applications filed since 2014, whereas they accounted for only 79.5% of those filed before 2013. Also, a larger proportion of the applications now originates from the United-States (from 39% to 58%) showing that the activity has greatly increased in this country thanks to the abovementioned legislative changes. This happened at the expense of almost all other jurisdictions, which have seen their share of the patent applications decline, with the exception of China, which kept about the same share (i.e., 20%-21%). This data shows that, if one were to look for a partner in the industry, the USA and China would be good places to start with.
Figure 2. Jurisdictions from which the patent applications originated
We can turn now to the jurisdictions in which the patent applications were filed. By looking at the countries in which your competitors field their patent applications, we can deduce where they believe their main markets are and where they believe their technologies is most promising. Again, the reasons underneath these numbers could be investigated: is a country selected because of the size of its market, its accommodating legislations, its business incentives, or other reasons? This can tell you where to file your own patent applications. It may also help you identify underserved markets that you may want to develop in with lesser interference from your competitors’ patents.
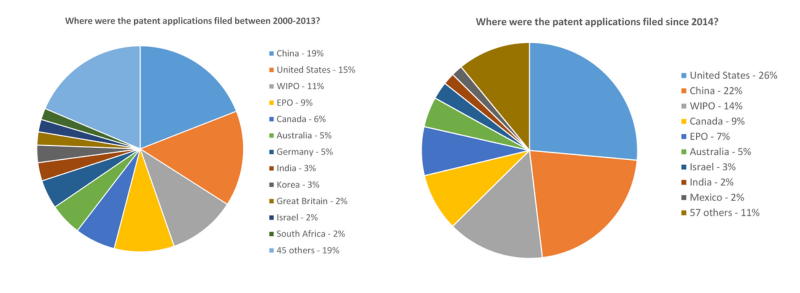
Fig. 3 below shows the jurisdictions where patent applications related to cannabis were filed before 2013 and have been filed since 2014. Patent applicants now seek to protect their innovation in a greater variety of jurisdictions (57 compared to 66) indicating that cannabis innovators believe their market is now more global. On the other hand, patent filings have become more concentrated with the top 5 jurisdictions (China, the United States, WIPO, EPO, and Canada), which have increased their total share from 60% to 78.5% of all patent applications. This indicates that, despite the above, cannabis innovators are concentrating their marketing efforts in the USA, in Europe, and in China.
Figure 3 also clearly reveals the impact of the 2018 legalization of cannabis in Canada. Indeed, it has had a clear effect with the country share of patent applications increasing from 6% to 9%. In other words, cannabis innovators are now filing twice as many patent applications in our country, showing it is now a more interesting market to them, probably due to the legalization of cannabis.
Figure 3. Jurisdictions in which the patent applications were filed
Let’s continue by looking at the technological sub-fields to which the patent applications belong. This provide a high-level snapshot of which technologies are being developed. More interestingly, this can be drilled down to narrower technological sub-fields, or by various countries, or by specific competitor to have yet more information on “who is doing what and where”.
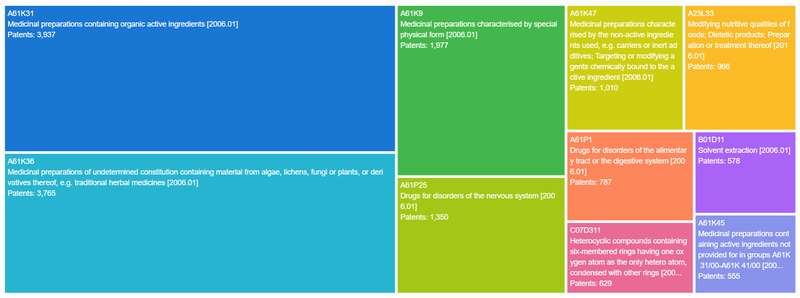
Figure 4 shows the technological sub-fields to which the cannabis-related patent applications filed since 2014 belonged. We can clearly see, somewhat unexpectedly, that the recreational use of cannabis, while responsible for generating initial business interest in the field, does not seem to be the driving force behind patenting activities. Indeed, one might have expected activities ancillary to such use including technologies to grow, cultivate, track, and store cannabis, would be prominent. It rather seems that the health industry dominates since most of the patent applications relate to medicinal preparations and drugs for specific disorders. A smaller number of patent applications relate to foods with modified nutritive qualities and methods of isolation (extraction).
Interestingly, after some drilling down, we noted that China has the largest number of patent application filed in the following classifications:
- A61K36 – traditional medicines, and
- A61P1 – drugs for the digestion system,
perhaps indicating a larger potential market for this type of innovation in this country. Meanwhile, the United States dominates in the following classifications:
- A61K31 – medicines containing organic ingredient and
- A61K9 – medicines having a special physical form.
Figure 4. Patent classification distribution (the size of the boxes indicate their relative prominence)
A patent landscape can help you identify who exactly is patenting technologies in your field. This allows you to identify your competitors as well as potential partners, licensees, or licensors. It also tells you whether innovation is driven by academic institutions (potential licensors) or by companies. You can also look at the size of your competitors to assess whether you are evolving among many small startups, competing against giants, etc. You can even look at the past litigation/enforcement behavior of the top patent filers as part of a risk assessment analysis. Again, this data can be drilled down to see what each top competitor is patenting, where, and when and where they themselves are located.
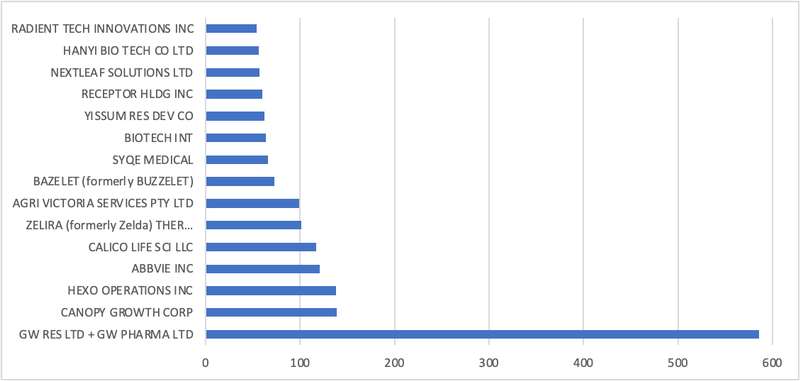
Therefore, to conclude this “Patent Landscape Teaser”, figures 5 and 6 show the top 15 owners of the cannabis patent applications filed between 2000-2013 and since 2014, respectively. GW, a British pharmaceutics company focused on cannabis products, has consistently been the top filer in this field. In contrast, all the other top filers have changed denoting a fundamental change in the cannabis industry landscape. Before, 2014, the top filers were mostly pharmaceutical companies and large corporations with varied business interests indicating that, for most patent filers, cannabis was more or less a side project. After 2014, many cannabis-focused companies appear and take top spots: Canopy Growth, Hexo Operations, Zelira, Bazelet, Syqe, Receptor, Nextleaf, Hanyi, and Radient. This trend clearly reflects the fundamental change brought upon the industry by the Green Rush, which led to the creation of numerous new players in the field. A company before 2014 clearly did not face the same challenges and opportunities as one evolving now.
Figure 5. Top 15 owners of the patent applications filed between 2000-2013
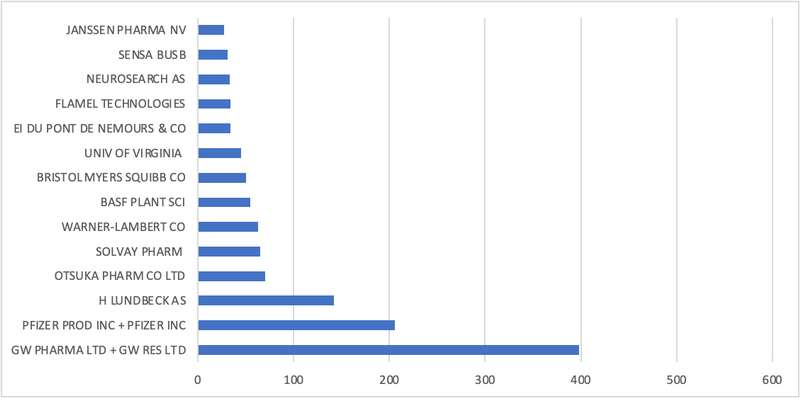
Figure 6. Top 15 owners of the patent applications filed since 2014
In summary, the data shown above clearly illustrates the rapid and profound impact that the legalization of cannabis has had on cannabis innovation. The patent landscape analysis allowed identifying many trends and facts indicative of a nascent technological field or one having received a recent boost. In other circumstances, other trends would have been observed. For example, we can expect to see a reversal of most of the above trends as the technology matures yielding fewer patent applications, as less proficient companies fail yielding fewer patent applicants, and as the market stabilizes resulting in patent applications being filed in possibly fewer and more well-defined markets.